Is Money Necessary?
The model explained in plain language
The short version
- Money is one way to decide who gets what. It is not the only way. Huge amounts of sharing already happen without it.
- We built a model that compares two ways of sharing out the same work, materials and energy among the same people: with money, and without it.
- If you only count how much stuff gets made, the two come out close. The money way is slightly ahead in about three out of four test runs.
- If you count how much good that stuff does for people, sharing by need comes out ahead in almost every test run — in all of them when compared with very unequal countries.
- Even when there is enough to meet everyone’s needs, sharing by money leaves many people short. Sharing by need meets every need and leaves capacity to spare.
- The model has real limits. This page explains them, too.
What we care about most. The Transition does not put “more stuff” ahead of people’s wellbeing or of getting along well together. We show the “how much stuff” result anyway, to be complete and honest. But the “how much good it does” result is the one that matches our goals.
How sure can we be? Societies are not machines. No model can predict them exactly. So instead of one answer, this model tests thousands of possible answers, and tells you where the result holds up and where it depends on guesses.
1. The question
Every society has a limited amount of work, materials, energy, land and machines. People have needs: food, homes, care, tools, learning. Somehow, what the society can make has to reach the people who need it.
Today, money does most of that job. Things go to whoever can pay for them. Factories make what sells.
So we asked two questions. First: is money actually required to do this job? Second: if not, which way does the job better — with money, or without it?
2. Can it be done without money at all?
Yes. Money is not required in principle. But no whole modern country has run without it yet. So here is the careful version of the claim: money is not logically necessary, and sharing without it already works at very large scale inside today’s economies.
The maths does not need prices
Strip the problem down. You know what people need. You know how much work, material and energy you have. You want to meet needs as well as possible without using more than you have. That is a maths puzzle. No prices, wages or bank accounts appear anywhere in it.
A mathematician named Leonid Kantorovich worked out how to solve this kind of puzzle in 1939, and later won a Nobel memorial prize for it.[1] Our script solves one with 10,000 people, 60 kinds of goods and 6 kinds of limited resources. A normal laptop finishes in under two minutes. Even when there is not enough to go round, every need is met to at least 74.8%.
So the calculation is not the hard part. The hard part is getting good information about what people actually need and what can actually be made.
The strongest objection
In 1945 the economist Friedrich Hayek made an important point. The knowledge needed to share things out well is spread across millions of people. Much of it is local, and some of it people cannot even put into words. No single office could ever collect it all. Prices, he said, pack that knowledge into a single number.[2]
History backs him up about central planning — one authority collecting information and giving orders. Countries that tried it had constant shortages of some things and piles of unwanted other things.[3] Those failures were real.
The Transition is not central planning. It is not market-based either. It is polycentric coordination, which means “many centres”: a neighbourhood, a town or a clinic network matches its own needs to its own abilities. It watches simple signals such as stock levels, waiting lists and how much things get used. It shares information and spare goods with neighbouring places and wider regional groups. There is no central bank and no central office deciding for everyone. Elinor Ostrom won a Nobel memorial prize for showing that this kind of many-centred self-government can manage shared resources well.[4]
Keeping decisions local answers part of Hayek’s objection. The people who know the local situation make the decisions. Three problems remain, and the model counts all three:
- Learning about other places. Each place has to find out about shortages and spares elsewhere, and summaries always leave some details out.
- Trying new things. Markets reward people for inventing new products. A system built around needs has to build its own ways to encourage that.
- Keeping people contributing. Without the pressure to earn a wage, people still have to choose to do the work.
A small test run
The script includes a small simulated network: 12 local places arranged in a ring, 20 kinds of goods, and needs that change at random. Each place sees only its own stocks and waiting list, plus its two neighbours’ waiting lists. It meets local needs first, passes leftovers on (losing 10% along the way) and shifts work toward whatever has a waiting list. No prices. No central office.
A make-believe “all-knowing” planner that knew every need in advance met 100% of needs. The simple local network met 92.8%. That is close — but the gap is a real loss, and the main model counts it.
When there is not enough — and when there is
The maths puzzle above tests the hard case on purpose: there is physically not enough to go round. That case matters. No way of sharing can make more of something than the work, materials and energy allow. (This is real shortage, not the fake kind, where goods are held back to keep prices high.)
But for many things people truly need, the other case is likely the real one: there is enough, or more than enough. So we ran the same puzzle again, with 2,000 people, at different amounts of capacity: from 0.8 times what everyone needs (a shortage) up to 3 times (plenty to spare). Each time, the same people with the same needs got the same capacity, shared out in two ways:
- By need, with no prices, as in the puzzle above.
- By money: prices go up or down until everything made gets bought, and people buy what their income allows. Each person buys for their needs first, and spends anything left over on extras. We tried this with incomes spread out the way they are in the most equal countries, in the US, and in very unequal countries such as Brazil or Colombia.
We gave the money side every advantage: everyone has a job, everything made gets sold, no big firm overcharges, and nothing is lost to handling money. We also left out public services such as public clinics or food aid, which in real life fill some of the gaps. This test looks only at the way of sharing itself.
| How much capacity | Sharing by need | By money, most equal countries | By money, US-like | By money, very unequal |
|---|---|---|---|---|
| 0.8 times what everyone needs (not enough) | Everyone gets 80% of every need | 72.9% | 73.0% | 75.1% |
| Exactly enough (1 times) | 0%: every need met | 57.0% | 61.2% | 68.6% |
| 1.5 times | 0%: every need met, a third of capacity spare | 27.8% | 37.5% | 53.9% |
| 3 times | 0%: every need met, two-thirds spare | 2.3% | 8.6% | 27.5% |
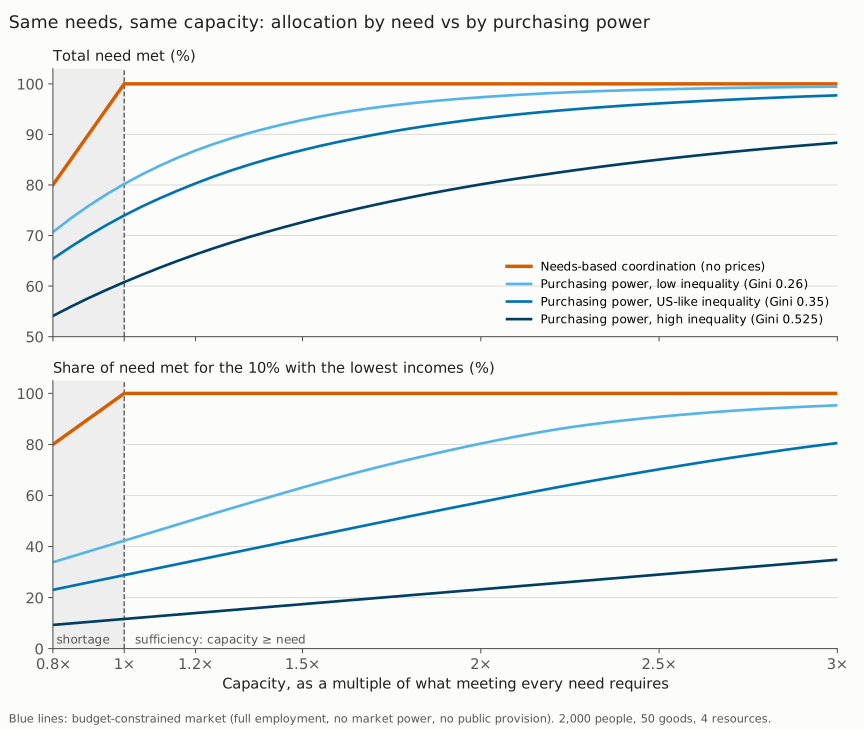
When there is not enough, sharing by need spreads the shortage evenly: everyone gets 80% of every need. Sharing by money gives the people with the lowest incomes much less (between 9% and 34% of what they need), while some capacity still goes to extras for people whose needs are already met.
When there is enough, sharing by need meets every need in full, with capacity left over. Sharing by money still leaves many people short, even though the things they need could be made. At 1.5 times capacity, between 28% and 54% of people are short of something, while 38–52% of all capacity goes to extras. Meeting every remaining need would have taken only 5–18%. Extras are not worthless to the people who buy them; the point is who gets served first. Even if everyone had the same income, people with bigger needs than average would fall short: almost half (48.6%) at exactly enough. This is the same pattern as in real life: hungry households next to piles of wasted food, and homeless people next to empty homes (see the table in section 3).
Where the money side does better than you might expect. With plenty to spare and fairly equal incomes, it gets close: at 3 times capacity in the most equal countries, only 2.3% of people are short. In very unequal countries, 27.5% still are. So how many people money leaves short depends mostly on how unequal incomes are and how much there is to go round. These amounts of capacity are examples, not measurements of any real country.
Having enough also helps the local network. We re-ran the 12-place network from the test above with spare capacity. With slightly too little (0.95 times average needs), it met 92.6% of needs. With 10% extra it met 99.8%, and with 25% extra, 100.0% — the same as the all-knowing planner. Spare capacity soaks up local mistakes. In a system that shares by need, spare capacity is not waste: it can be kept as a reserve, turned into shorter working hours, or used for things people decide on together.
Which case applies depends on the thing. Many basic needs are probably in the “enough” case once waste and things built not to last are removed. In the US, 31% of the food supply goes unsold or uneaten,[10] and homes standing empty for reasons other than sale, rent or holidays outnumber homeless people about four to one[12][13] (not all of them are livable, or where people need them). Worldwide, the number of times a piece of clothing is worn fell by about a third in fifteen years, while twice as much clothing was made.[19] Much learning and information can be copied again and again with little extra effort. Other things really are scarce, at least for now: specialist health care (skilled people take years to train), some materials, and land in some places. For those, the “not enough” case is the one that counts. This is a careful reading of the evidence, not proof for every single thing — which is why we tested both cases.
It already happens, every day
The best evidence that money is not required is how much sharing already works without it. Each example has limits, and we list them.
- Inside big companies. Goods move inside firms like Amazon by data and instruction, not by buying and selling. Amazon forecasts demand for over 400 million products every day.[5] Limit: these firms are run from the top, and still use money with customers and suppliers.
- Public health care. The UK’s NHS treats tens of millions of people a year by medical need, with no payment at the point of care.[6] Limit: it is paid for with money today, and waiting lists show where capacity runs short.
- Wikipedia and Linux. Huge projects built by people working together, open to everyone. Limit: copying information is easy, and most Linux developers are paid by employers.
- Blood donation. 79 countries collect over 90% of their blood from unpaid volunteers.[7] Limit: a small group of goods with strong habits of giving.
- Homes and families. Every day, people do 16.4 billion hours of unpaid care work worldwide — as much as 2 billion full-time jobs.[8] Limit: women do 76% of it, and it happens in small, close groups.
- Mutual aid. In 2020, about 4,300 neighbourhood groups in the UK formed within weeks to deliver food and medicine to people who needed them.[9] Limit: many faded when the emergency eased.
- History. For most of human history, hunting and gathering groups shared food by custom. Israeli kibbutzim ran for decades without wages inside the community. Limits: the groups were small, and by 2010 most non-religious kibbutzim had moved to paying different salaries. The Inca empire ran largely without money, but by force and from the top — proof of scale, not of fairness.
Put together: sharing by need works reliably, at huge scale, for vital goods and under stress. But the biggest modern examples sit inside money economies, and the past examples without money were small or ruled from the top. So the real question is not whether it works, but how its downsides at full scale compare with money’s downsides. That is what the model estimates.
3. How the model works
A model here means a set of careful calculations that stand in for the real world. Ours is a fair comparison:
- Same people, same needs, same abilities. The only thing that changes is how things get shared out.
- Way A, with money: goods go to whoever can pay, and production follows what sells.
- Way B, without money: many local places match needs to what they can make, as described above. Goods are open to everyone who needs them, without buying.
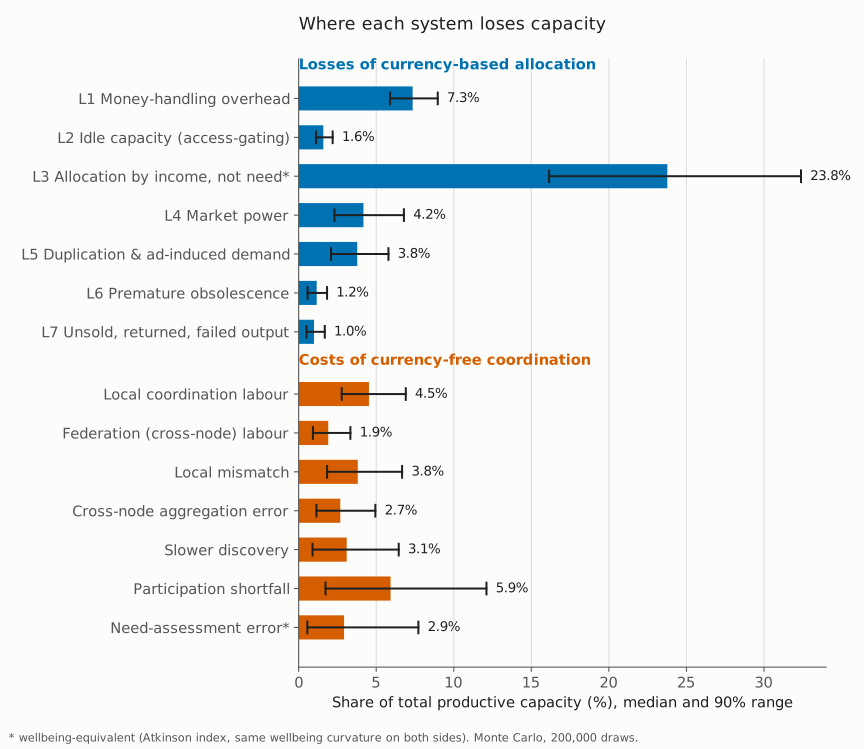
- Each way is charged for its own losses. Every system wastes something. We counted each side’s losses as a share of everything the society could make (we call that total its capacity). Whichever loses less, wins.
Losses on the money side
Middle estimates for the United States, where the most detailed data exist. Anything that would still be needed without money is subtracted, not counted as waste.
| Loss | In plain words | Size |
|---|---|---|
| Handling money | Work spent on banking, insurance, billing, tax forms and advertising, minus the record-keeping any system would still need. | 7.3% |
| Idle while needed | Things exist but sit unused because the people who need them cannot pay. In 2023, 31% of the US food supply went unsold or uneaten[10] while 13.5% of households were short of food.[11] In 2020, 3.36 million homes stood empty that were not for sale, for rent or used as holiday homes;[12] on one night in 2024, 771,480 people were homeless.[13] Only part of this is counted, because not all of it is caused by lack of money. | 1.6% |
| Sharing by income, not need* | Goods go to people who can pay, not to people who need them most. Explained in the next section. | 23.8% |
| Market power | Big firms charging far more than it costs to make things, and holding back supply. | 4.2% |
| Duplication and advertising | Making things people only want because of ads, and many parallel versions of the same product. | 3.8% |
| Built not to last | Replacing things sooner than needed. | 1.2% |
| Unsold and returned goods | Goods destroyed, returned or thrown away, and failed businesses. | 1.0% |
Losses on the no-money side
There is no full-sized modern example to measure, so these ranges are wide on purpose.
| Loss | In plain words | Size |
|---|---|---|
| Local organising work | People’s time spent collecting needs, matching, talking things through and keeping open records. | 4.5% |
| Linking places together | Sharing summaries and spare goods between places and regions. | 1.9% |
| Local mistakes | The wrong things, or the right things at the wrong time. | 3.8% |
| Mistakes between places | What gets lost when places only see summaries of each other — the part of Hayek’s problem that remains. | 2.7% |
| Slower invention | New products and methods may arrive more slowly. | 3.1% |
| People contributing less | Some people may work less without the pressure to earn a wage. | 5.9% |
| Misjudging needs* | Needs are never recognised perfectly. | 2.9% |
* These two count lost wellbeing, not lost goods. They are measured the same way on both sides.
How do we know people would keep working? We don’t know for sure — this is one of the biggest unknowns. The closest real tests are guaranteed-income experiments. In the largest US trial, people received $1,000 a month for three years. They worked about 1.3 to 1.4 hours a week less.[14] In Alaska, where every resident gets a yearly payment, employment did not fall.[15] Research on motivation also finds that people’s own interest drives the quality of their work, and that paying for things people value can weaken that drive (more on this). But none of this measures a whole society without money. So the model lets this loss go as high as 15% — more than double the effect seen in the trial.
4. Why “who gets what” matters so much
The biggest single loss in the whole model is sharing by income instead of need. Here is why.
Think about a warm winter coat. To someone who has no coat, it can matter enormously. To someone who already owns four, a fifth coat barely matters at all. The coat is the same. The good it does is very different.
This pattern — each extra thing helps a little less than the one before — is one of the best-supported findings about wellbeing. Large studies across many countries find that each doubling of income adds roughly the same boost to how satisfied people are with their lives, with no point where it stops.[16] So an extra $1,000 means far more to a family with little than to a family with a lot. A 2023 study by researchers who had earlier disagreed confirmed that, for most people, the pattern holds for day-to-day feelings, too.[17]
When goods go to whoever can pay, many of them go to people for whom they add little, while people with real needs go without. Measured this way, in a US-like economy, sharing by need could use about a quarter fewer goods (median 23.8%, range 16–32%) and still do as much good. In a very unequal economy, such as Brazil or Colombia, it is about half (median 49%).
To be fair to money: this loss is not caused by money alone. Countries that use money but share income much more evenly lose less. That is why we compare three kinds of money economy:
- Very unequal, like Brazil or Colombia.
- US-like.
- The most equal money economies that exist today, where this loss is about half the US size.
Inequality is measured with the Gini number: 0 means everyone has the same; 1 means one person has everything. The US is about 0.39; the most equal countries about 0.26; Brazil about 0.50.
5. What 200,000 test runs found
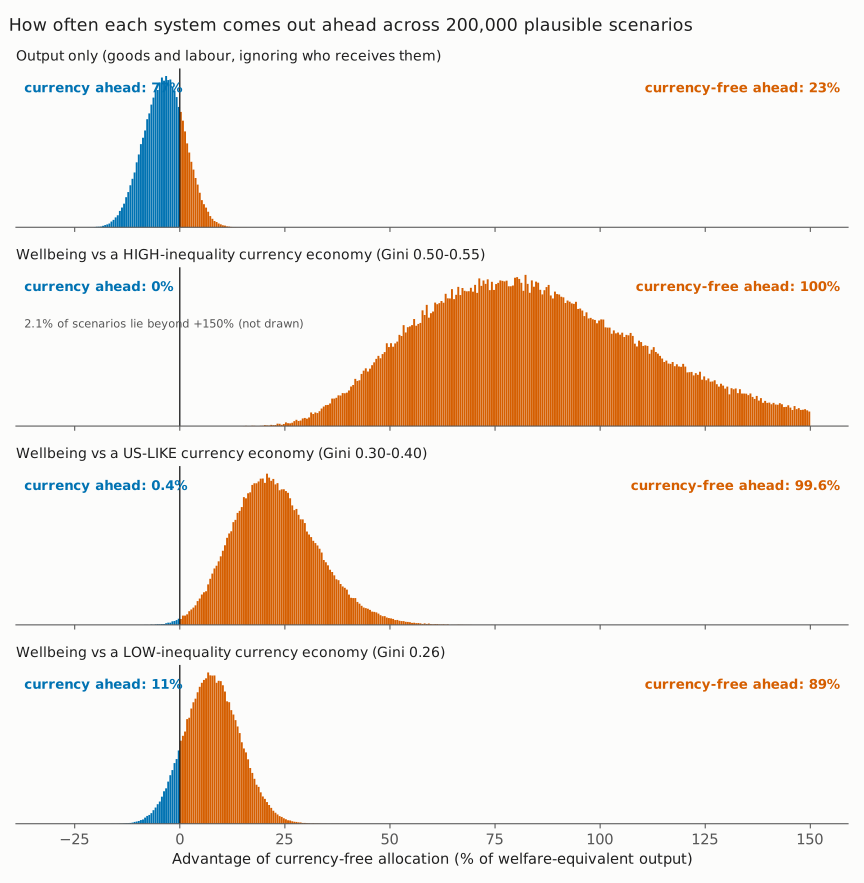
Nobody knows the exact size of each loss. So every loss has a range of believable values, based on evidence. The computer picked a random value from every range, worked out which way came out ahead, and repeated this 200,000 times. (This method is called Monte Carlo, after the famous casino, because it uses chance.) The random choices are fixed in advance, so anyone who runs the script gets exactly the same results.
| Compared with | Ahead in | Typical lead |
|---|---|---|
| Counting how much good it does (the comparison that matches our goals) | ||
| A very unequal money economy | 100% of runs | about 83% |
| A US-like money economy | 99.6% of runs | about 22% |
| The most equal money economies | 88.5% of runs | about 8% |
| Counting only how much gets made (included for completeness) | ||
| Goods and work, ignoring who receives them | 22.9% of runs | behind by about 3.6% |
“Typical lead” is the median: the middle value, with half the runs above it and half below.
What this means
Counting wellbeing, sharing by need is clearly ahead wherever inequality is at US levels or higher. That is true in every single run against a very unequal economy, and in 99.6% of runs against a US-like one. The reason is simple: when goods follow money, many go where they do little good.
We are more sure of the direction of the very-unequal result than of its exact size. At such high inequality, small choices in the maths make a bigger difference to how large the lead looks.
Against the most equal money economies, it is ahead in most runs, but not all (88.5%, typical lead about 8%). It falls behind when people contribute much less and organising is harder than expected. Only real practice, at growing scale, can settle those questions.
Counting only how much gets made, the two are close, and money is usually slightly ahead. Money’s losses add up to about 19% of capacity; the no-money losses add up to about 23%. Money comes out ahead in about three out of four runs, by a typical 3.6%. So this model does not support the claim that removing money would, by itself, produce more goods from the same resources.
6. Which guesses matter most
We also pushed each assumption, one at a time, to the low end and the high end of its range, to see which ones could change the answer.
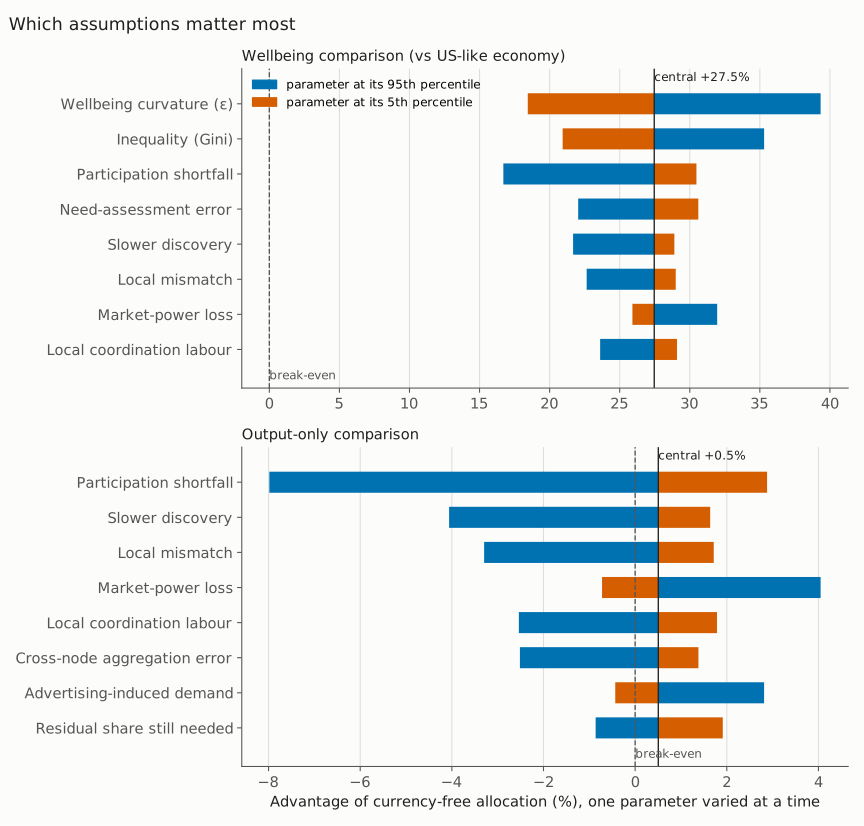
- For wellbeing, the answer depends most on how fast extra goods stop mattering, how much less people would contribute, and how unequal the money economy is. But no single assumption, pushed to its limit, flips the result.
- Against a US-like economy (with other values in the middle), sharing by need stays ahead as long as people contribute less than 24.7% less — over four times the drop seen in the guaranteed-income trial.
- For how much gets made, the answer depends above all on how much less people would contribute. The two ways tie if people contribute about 4.5% less — close to what the largest guaranteed-income trial found.
- The well-measured losses, like the work spent handling money, barely move the answer. Their ranges are narrow because the data are good.
7. What about the 15–17-hour work week?
Elsewhere, this site estimates that a Transition society could need only about 15–17 hours of work a week. This model does not show that. Here is why, honestly.
This model asks one narrow question: is money needed, and what does each way lose when making today’s mix of products? It keeps today’s pattern of production mostly as it is. Within that narrow question, the hours of work needed barely change: about 40 hours a week for today’s workers, compared with 38.6 now (range 37–44).
The 15–17-hour estimate rests on changes this model does not include, mainly:
- making things to the highest practical quality, built to last and easy to repair and upgrade, so that production slows down as needs are met;
- ending the endless cycle of produce, consume, throw away and replace, and the pressure to keep production and consumption high for its own sake;
- sharing necessary work across all adults who are able to work;
- whole kinds of jobs disappearing, including handling money.
This is a difference in scope, not a contradiction. This model neither tests nor confirms those other changes.
8. What we know, and what we don’t
Well supported
- Money is not logically or technically required to share out what a modern society can make.
- Sharing without money already works reliably, at large scale, inside today’s economies.
- Sharing by income loses more wellbeing than organising without money loses through extra effort and mistakes: in every run against very unequal economies, over 99% against US-like ones, and 88% against the most equal ones.
- When there is enough to go round, sharing by need meets every need, while sharing by money leaves people short whenever incomes are unequal compared with needs.
Not shown
- That a whole modern society can run without money. The model estimates; it does not prove.
- That sharing without money would make more goods. On that count, money is usually slightly ahead.
- Anything about the 15–17-hour week.
- Exactly which things there is already enough of, and how much, in any real country. The “enough” test uses example amounts.
The main weak spots:
- The losses on the no-money side, and some on the money side, are careful judgements based on evidence, not measurements of a full-sized example. That is why their ranges are wide.
- Most of the data come from the United States. Other countries spend less on things like health-care paperwork, and are more or less unequal.
- The model compares two settled states. It does not model the journey from one to the other, or the effort of trading with countries that still use money.
- It assumes everyone gains wellbeing from goods in the same basic way. It does not count the value some people place on choosing in a market — or, on the other side, the harm of money worries, which research shows can measurably reduce people’s ability to think clearly.[18]
- The small network test shows the idea working. It is not a measurement of a real network.
9. Check it yourself
This is a Python program that recalculates every number and redraws
every chart on this page and the technical page. You can open it in
any text editor and read it first: every assumption is listed near
the top, with where it came from. You need Python 3 with three
add-on packages (numpy, matplotlib and scipy). Then one command runs
it: python3 money-vs-moneyless-model.py. It takes about
two minutes on a laptop, prints the results, and saves the four charts in a new
folder. Change any assumption you disagree with and run it again.
Step-by-step details are in the
technical version.
Anyone may use, share and change the script, for any purpose. If you share a changed version, it has to stay open in the same way, so improvements remain open to everyone. (This is the GNU General Public License, version 3 or later.)
Want the full detail? The full technical version has the equations, every data source, all 73 references and a longer table of real-world examples.
Related: Post-Currency Foundations describes how coordination without money would be organised; Oligarchic Capture explains how sharing by money concentrates wealth over time.
Sources used on this page
A selection. The technical version lists all sources.
- L. V. Kantorovich, “Mathematical Methods of Organizing and Planning Production,” Management Science 6(4), 1960 (translation of the 1939 original).
- F. A. Hayek, “The Use of Knowledge in Society,” American Economic Review 35(4), 1945.
- János Kornai, Economics of Shortage (North-Holland, 1980).
- Elinor Ostrom, “Beyond Markets and States: Polycentric Governance of Complex Economic Systems,” American Economic Review 100(3), 2010.
- Amazon Science, “The evolution of Amazon’s inventory planning system.”
- UK Department of Health and Social Care, “The NHS Constitution for England,” principle 2.
- World Health Organization, “Blood safety and availability” (fact sheet).
- International Labour Organization, Care Work and Care Jobs for the Future of Decent Work (2018).
- Anne Power and Ellie Benton, “Where next for Britain’s 4,300 mutual aid groups?” LSE COVID-19 blog, May 2021.
- ReFED, “From Surplus to Solutions: A Q&A on ReFED’s New U.S. Food Waste Report” (2023 data).
- Matthew P. Rabbitt et al., Household Food Security in the United States in 2023, USDA Economic Research Service, 2024.
- US Census Bureau, “Housing Characteristics: 2020,” 2020 Census Brief.
- US Department of Housing and Urban Development, The 2024 Annual Homelessness Assessment Report to Congress, Part 1.
- Eva Vivalt et al., “The Employment Effects of a Guaranteed Income: Experimental Evidence from Two U.S. States,” NBER Working Paper 32719, 2024.
- Damon Jones and Ioana Marinescu, “The Labor Market Impacts of Universal and Permanent Cash Transfers: Evidence from the Alaska Permanent Fund,” American Economic Journal: Economic Policy 14(2), 2022.
- Betsey Stevenson and Justin Wolfers, “Subjective Well-Being and Income: Is There Any Evidence of Satiation?” American Economic Review 103(3), 2013.
- Matthew A. Killingsworth, Daniel Kahneman and Barbara Mellers, “Income and emotional well-being: A conflict resolved,” PNAS 120(10), 2023.
- Anandi Mani, Sendhil Mullainathan, Eldar Shafir and Jiaying Zhao, “Poverty Impedes Cognitive Function,” Science 341(6149), 2013.
- Ellen MacArthur Foundation, A New Textiles Economy: Redesigning Fashion’s Future (2017), “Summary of findings.”